


 Ireland The Voyage
24 Feb 2026 - Renmark
 Cirque Nouvelle
14 Apr 2026 - Renmark
 Lewis Major: Triptych
14 Mar 2026 - Renmark
 Song Sung Blue. The Neil Diamond Experience featuring Troy Harrison. A Story in Every Song.
06 Mar 2026 - Renmark
 Kevin Bloody Wilson Aussie Icon Tour with special guest Jenny Talia
27 Mar 2026 - Renmark
Use and Consumption of Murray River Water
Source: The Murray; Murray Darling Basin Authority
Related Information
- Water Authorities
- Murray Darling Basin Authority
- Murray-Darling Basin
- River History
- Murray River Timeline
- A River Worth Saving
- Educational Resources
- Locks, Weirs & Dams
Discover Murray
Irrigation is the largest user of water from the River Murray system. An annual average of approximately 3,780 GL is currently diverted from rivers under Murray Darling Basin Authority (MDBA) control to irrigate a total area of 470,000 ha. Table 1 shows the area currently irrigated and the quality of water used in each State.
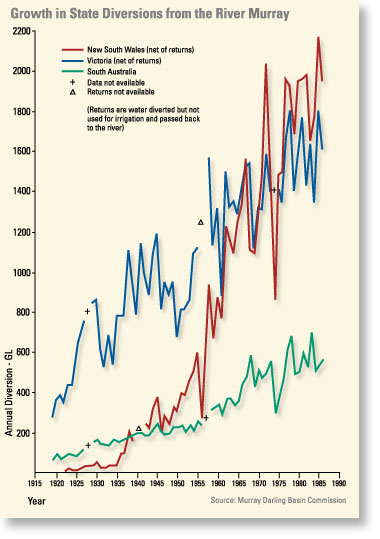
Development of irrigation areas is controlled by the individual States. Diversions by Victoria and South Australia have grown steadily this century, whilst diversion in New South Wales grew rapidly after World War II. New South Wales is currently the largest user of water. The graph below shows the growth of State diversions from the Murray.
The amount of water made available for irrigation in New South Wales is controlled by an allocation system, based on farm area. Supplies are varied by the Government each year by setting the proportion of allocation that may be used, according to New South Wales’ share of water controlled by the MDBA. An embargo on issuing new water entitlements for irrigation has been in place since 1975. A system of transferring water entitlements between farms was introduced in 1983, which has allowed increased water usage in some areas. Irrigators may also be allowed to increase usage in the current year by borrowing from the following year’s water allocation.
 New South Wales has the lowest proportion of total farm area irrigated out of the three States (see left). There is little scope for a larger area to be irrigated unless new water entitlements are issued. This may not be acceptable, however, because it may reduced the security of supply to all States. Irrigated crop types in New South Wales are mainly pastures, cereals, rice, grapes and citrus.
In Victoria, irrigated water entitlements are determined under a system of water rights, sales water and licences based on farm area. Water availability each year is varied by the Government by adjusting the amount of sales water, according to Victoria’s share of MDBA available water. Victoria has a quantity of water made available by the construction of the Dartmouth reservoir, that has not been allocated yet. A limited system of water transfers between farms exists. Pasture is the predominant crop type, followed by grapes, cereals and orchards.
In South Australia, water entitlements are controlled by licences based on past consumption, and allocations based on water application rates per unit area. Water availability is varied little from year to year, unlike the two upper States, because supplies are taken from within South Australia’s fixed entitlement flow. A moratorium on issuing new licences has been in place since 1968 as a result of South Australia receiving less than it’s entitlement flow in the severe drought of 1967/68. Water allocations may be transferred between farms.
During periods of shortage (less than the entitlement flow), water usage may be reduced by varying the conditions of irrigation licences. The principal irrigated land use is horticulture and pasture. The graph above shows South Australia has the highest average intensity of water application, due to the extent of horticulture along the river. Comparison with the other States should be treated cautiously, however, due to the inconsistent nature of the data (refer notes to Table 1).
When flow in the Murray exceeds downstream requirements, the States may declare a period of ‘surplus flow’. Additional usage is possible at this time through either increase water entitlements or not counting usage as coming from the water allocation. Periods of surplus flow in South Australia are declared on a monthly basis, whereas in the upper States the duration is not fixed and is varied depending on circumstances.
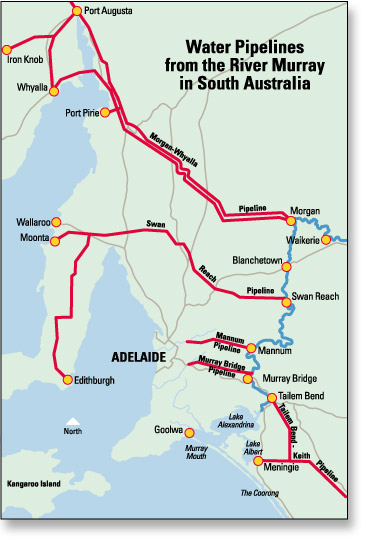
Diversions from the Murray for purposes other than irrigation, that is, for stock, domestic, urban and industrial uses, currently total about 200 GL per annum. The bulk of this is for domestic and industrial supply in South Australia (see pipeline map). Adelaide receives 55% of its water supply from the Murray on average. In the 1982/83 drought, 90% of Adelaide’s supply was pumped from the Murray. The “Iron Triangle” industrial area receives 90% of it’s water from the Murray.
TOP | MURRAY DARLING BASIN MAP
Water Allocation
During each irrigation season, the Commission assesses the volume of water expected to be under it’s control so that it can be allocated to the State. Only one assessment may be necessary if resources are ample and the reserve of water held in storage at the end of the season is forecast to exceed 2,500 GL.
When resources are scarce, numerous assessments over the irrigation season may be necessary. The main decision to be made by the Commission under these circumstances relates to trading-off State supply in the current year against security of supply in the following year; which is directly related to the size of the reserve storage. Also, under severe drought conditions, the Commission will consider declaring a period of water restriction if the forecast reserve is less than 2,500 GL. The last time a period of restriction was declared was in 1967/68.
The three States have very different supply security requirements which at times makes it difficult for the Commission to reach agreement on the size of the reserve. If agreement cannot be reached, it is set to the 2,500 GL.
Decisions on State supplies are currently based on minimum inflow (dry) conditions. This is necessary because it is not acceptable to farmers for irrigation allocations to be reduced part way through the season. This could occur if planning was based on receiving higher inflows and a low reserve and a drought ensued. The magnitude of inflows and a low reserve availability is the main factor which determines whether increased supplies become available during the season. Under this system, it's left to irrigators to gamble on inflow conditions improving when decided what area of crops to plant early in the season.
The MDBA’s water allocation procedure is demonstrated in Table 1. The volume of water under Commission control and available for allocation to the States is calculated as total resources less total commitments and the reserve.
When resources are ample, South Australia receives its full entitlement (at least) and the upper States share the rest. When resources are scarce, the available water may be shared equally between the three States. Expected State tributary inflows are then added to their share of MDBA available water to determine allocations. South Australia’s allocation is calculated as its share of MDBA available water plus its dilution flow allowance.
TOP | MURRAY DARLING BASIN MAP
 Security of Supply
The type of irrigation farming in New South Wales does not require high supply security. The area of cash crops planted such as rice and cereals is varied depending on how much water is available. For this reason, as high an allocation as possible is sought early each year and low priority is given to supplies in the following years. Considerable importance is placed on increasing usage over the season by utilizing surplus flows in the River.
The irrigated pastures which predominate in Victoria require a high supply security. It is essential that the reserve of water carried over to the next season in sufficient to ensure that full water right can be delivered if a drought occurs. In non-drought years, a minimum supply of 130% of water right is usual.
Even higher security if required by South Australia because of the predominance of permanent plantings in irrigated areas and the reliance on the Murray for urban and industrial supplies. These uses are normally fully satisfied because of the high security of South Australia’s entitlement flow.
TOP | MURRAY DARLING BASIN MAP
River Operations
The MDBA meets States water requirements along the Murray with minimum wastage by:
- Storing water in the wetter winter/spring months and later releasing it during the drier summer/autumn months to meet supply requirements.
- Making releases from the most downstream storage first to minimise losses due to spill.
- Making timely releases from major sources to accurately match water supply with demand, with close attention paid to the time it takes for flow to travel along the Murray. The upper States assist by estimating and advising the Commission of their future water requirements at each off-take point along the Murray and also by estimating future tributary inflows.
- Using a network of flow gauging stations along the Murray and its tributaries to continuously monitor river flows.
- Utilizing mid-river storages to re-regulate flows if supplies do not exactly match demand.
Other operational objectives defined in the Agreement include:
- Providing dilution flows of up to 2,450 ML/day and 3,900 ML/day past Euston and Torrumbarry Weirs respectively, to prevent the salinity of river water at Merbein and Swan Hill from exceeding 500 EC units as far as possible. These flows are in addition to downstream water supply requirements.
- Providing a depth of water at locks and weirs sufficient for navigation by vessels drawing 1.4m of water.
There are numerous other, often conflicting requirements that the MDBA attempts to meet in its operations. It does this provided that the water conservation objective is not significantly prejudiced. Other requirements include:
- Proving flood protection
- Improving water quality
- Protecting and enhancing the river environment
- Allowing electricity generation
- Meeting recreational needs.
The MDBA would release stored water to meet such objectives, however, at the request of a State, with the water being taken from that State’s share of MDBA available water.
TOP | MURRAY DARLING BASIN MAP
How much water is needed to produce food?
CSIRO Land and Water scientists have used precision weighing systems to measure water use by various crops, and the yield from the crops. The following approximate figures were revealed:
- To produce one kilogram of oven dry wheat grain, it takes 715 - 750 litres of water
- For 1 kg maize, 540 - 630 litres
- For 1 kg soybeans, 1650 - 2200 litres
- For 1 kg paddy rice, 1550 litres
- For 1 kg beef, 50,000 - 100,000 litres
- For 1 kg clean wool, 170,000 litres
These figures were determined in very controlled conditions. They can vary with the environment and with the methods of water delivery and harvesting used. Although many people react with amazement at these figures, we should be cautious about interpreting them. The numbers don't necessarily imply that some types of food are better than others. They do emphasise the large amount of water that is needed to grow food, and demonstrate that we should be investigating ways to conserve and improve water use efficiency.
How is water lost?
All plants, whether irrigated or rain fed, transpire water from the leaves to reduce the temperature when exposed to the sun. If crops are irrigated then a lot of water that is taken from a river or dam can be lost through seepage, evaporation and transpiration, before it actually gets to the farm. Recent documentation of the effectiveness of water conveyancing in the Murray-Darling Basin from river to farm gate shows that up to 85% of water can be lost when open earthen channel supplies are used. On the other hand, as little as 5% can be lost when new fully piped systems are used and managed well.
Where does water come from?
97% of the world's water is contained in the oceans as saltwater. The remaining 3% is fresh water made up in the following parts: 2.25% in polar ice caps and glaciers; 0.6% in underground water; and 0.15% in streams, lakes, and the atmosphere. During the hydrologic cycle water undergoes a continual change of state between liquid, solid and gas in four distinct processes.
These processes are:
- evaporation and transpiration
- precipitation (rain, hail, sleet or snow)
- infiltration
- runoff

Tell your friends you found this at murrayriver.com.au!
Copyright Discover Murray 2026. This site or any portion of this site must not be reproduced, duplicated, copied, sold, resold, or otherwise exploited for any commercial purpose that is not expressly permitted by DISCOVER MURRAY.